


Last week, the AI trade had one of its worst weeks since June. The PHLX Semiconductor Index fell 11.4% (eight straight down days), the Nasdaq Composite lost 4.5%, and the S&P 500 dropped about 2%. Interestingly, the epicenter wasn’t the chipmakers. It was the companies that borrow money to rent out the chips, often called “neocloud” companies. CoreWeave, for example, buys Nvidia hardware and funds it largely with debt secured by the chips and its customer contracts. The stock fell 15.5% on Wednesday alone after its unsecured bonds touched a 15% yield. It bounced Thursday when Nvidia CEO Jensen Huang defended the company, then dropped again Friday, finishing the week down roughly 25%. The eight listed neocloud names averaged a 22% weekly loss, compared with 6.6% for Nvidia itself.
So why are the buyers hurting more than the suppliers? Borrowing costs. CoreWeave’s 9.75% notes due 2031 were trading near 82 cents on the dollar with a yield above 15%, up from roughly 12% two months ago. The cost of insuring its debt against default hit a record, implying roughly a 60% chance of default over the next five years. In its second quarter, the company generated about $679 million in operating cash flow while spending roughly $6.4 billion on equipment, and its net interest expense ($640 million) more than doubled. Management points to a $104 billion backlog and hopes to earn investment-grade ratings that would open the door to insurance-company capital. That plan looks fraught with peril when rates are staying higher for longer and investors are demanding 15% to lend to the company.
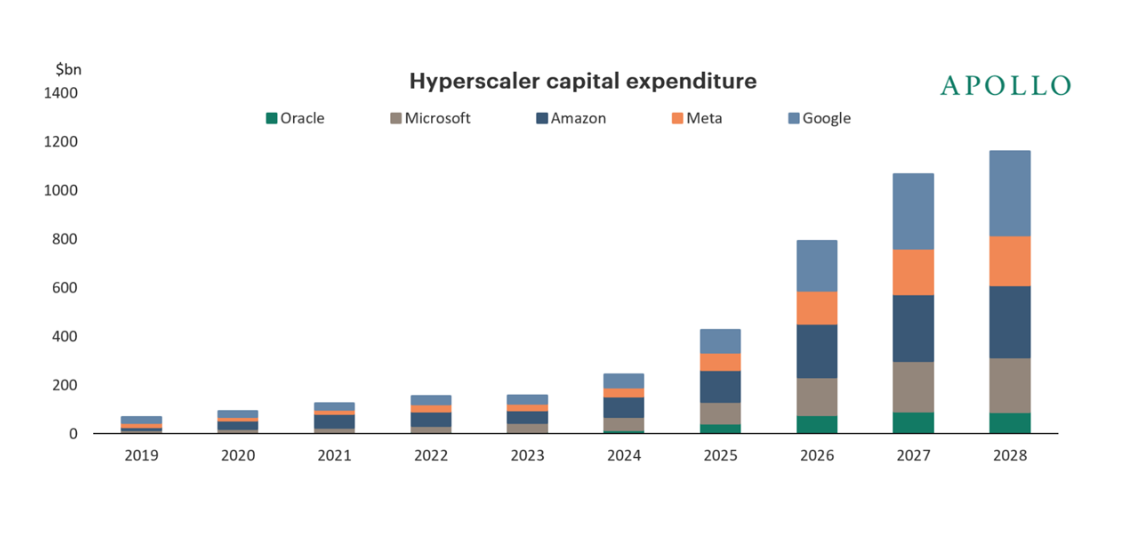
The underlying demand for chips still looks strong. ASML warned it may not be able to meet demand in 2027, and TSMC was expected to post profit growth near 60%. See below for a recent chart from Apollo on past and expected AI spending from select hyperscalers (the giants like Microsoft, Amazon, and Google):
 Source: Apollo
At the end of the day, “AI” gets used as a catch-all, but not all AI exposure is created equal. Chip designers with strong cash flow, hyperscalers, and highly leveraged data-center renters carry very different risks. For your portfolio, that means owning AI isn’t one bet. We pay close attention to which kind of AI exposure you hold, and how much of it depends on borrowed money.
Earnings Season Starts Strong While Expectations Slip
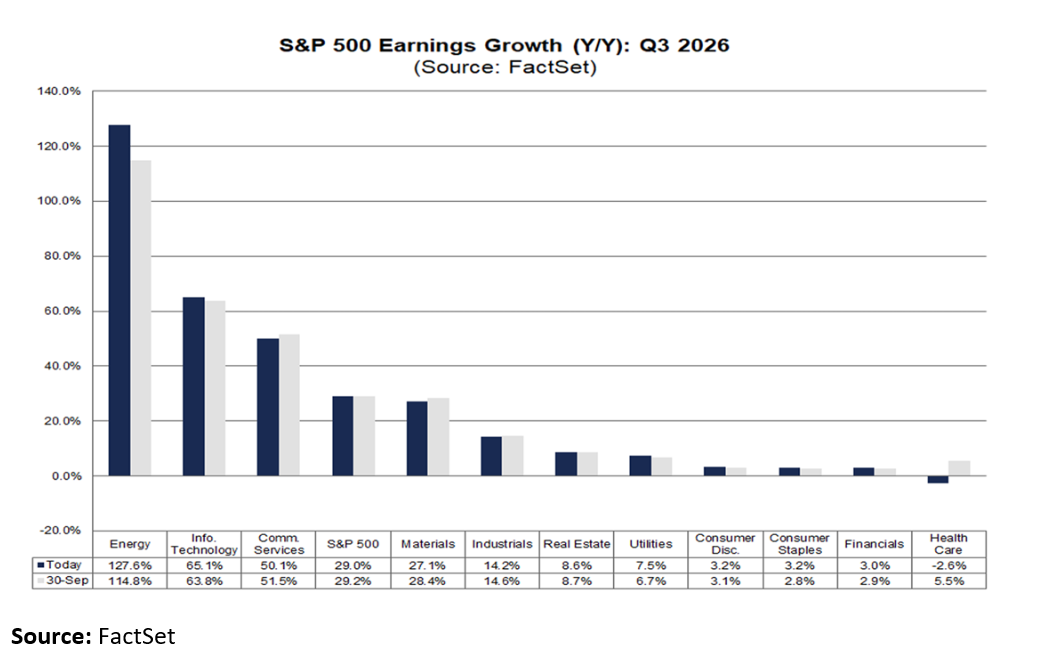
It’s still early in earnings season. According to FactSet’s October 16 Earnings Insight, only 9% of S&P 500 companies have reported third-quarter results. Of those, 84% beat earnings estimates, above the five-year average of 78% and the 10-year average of 77%, while 67% beat on revenue, roughly in line with historical averages (70% five-year, 68% ten-year). Earnings growth so far is 29.0%, with revenue growth of 12.6%. If those numbers hold, it would mark the third straight quarter of earnings growth above 25% and the eighth straight quarter of double-digit growth. That said, expectations have slipped slightly, from 29.2% to 29.0% since the end of last quarter. See below for expected earnings growth by sector:
Source: FactSet
Here’s something you may not be hearing in the headlines: as earnings have grown, valuations have actually come down. The S&P 500 now trades at 19.0 times expected earnings over the next 12 months, below the five-year average of 19.8 and close to the ten-year average of 19.1. In plain terms, despite recent volatility, the market isn’t priced for perfection, which is part of why we aren’t making reactive changes. With 79 S&P 500 companies reporting this week, we’ll have a clearer picture soon.
Credit Is Starting to Price in Risk, Especially CCC Rated Bonds
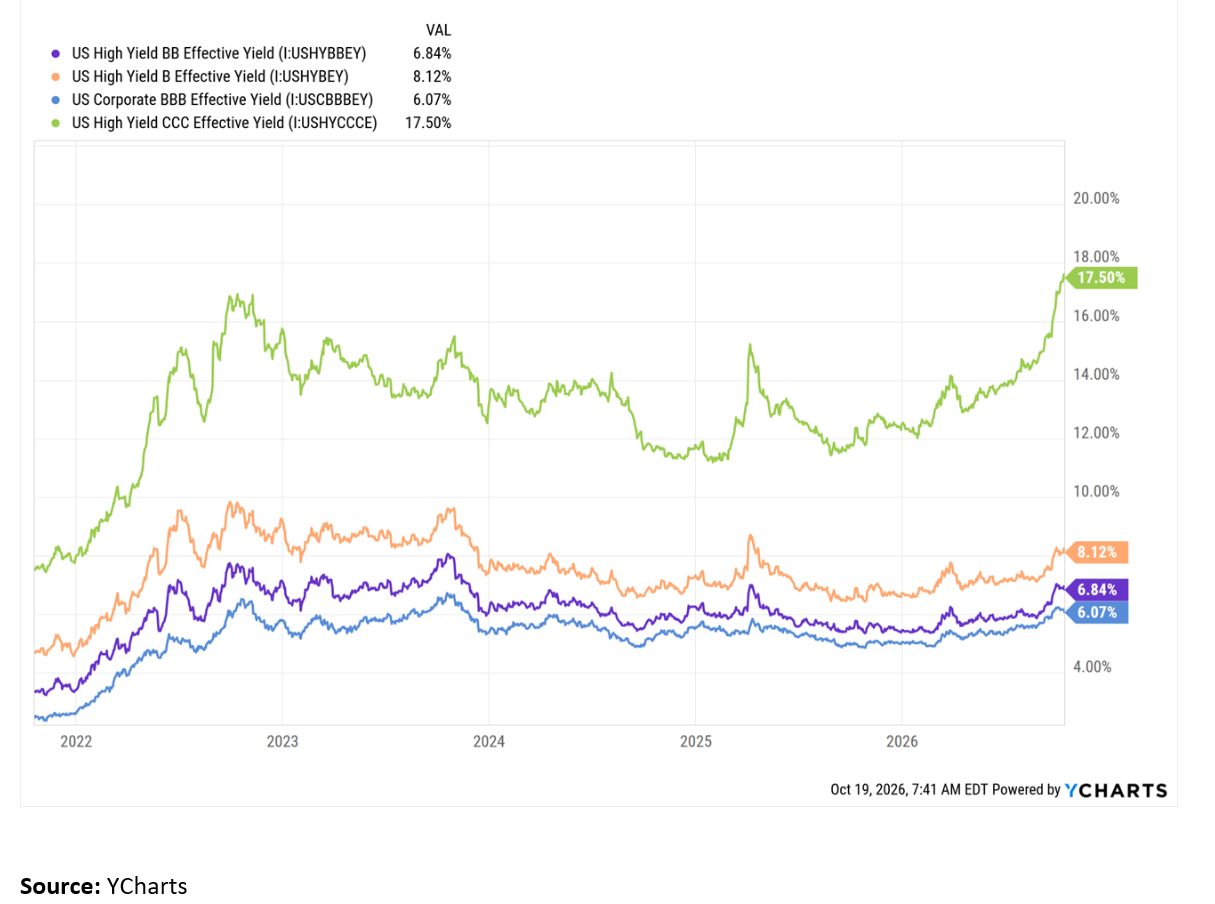
Most of the attention in the bond market this past month has been on Treasury yields, and for good reason. The 10-year touched 5.36% earlier this month, its highest level since 2002. But the Treasury rate is only one part of what a company pays to borrow. The other is the credit spread, the extra yield investors demand to compensate for the risk of default, and that has started to move too. Yields have risen across the risk spectrum, but the move has been especially pronounced in CCC-rated bonds, the lowest tier of corporate credit. See below for yields across the corporate credit spectrum:
Source: YCharts
You’d have to go back to 2022, when nearly every economist was forecasting a recession within 12 months, to find CCC yields this high.
So what’s behind the jump? A few things. Much of the lowest-rated debt was issued in 2020 and 2021 at low rates and now has to be refinanced with Treasury rates above 5%. When companies do default, investors have recovered only about 29 cents on the dollar recently, well below the 25-year average near 40 cents. Cable and satellite, industrials, and packaging have led defaults, and distressed leveraged loans (those trading below 80 cents on the dollar) have climbed to about $140 billion, up nearly 90% in a year, with technology companies making up the largest share.
For context, CCC is the riskiest rating tier and has always carried real default risk. S&P Global Ratings data from 1981 through 2024 show that CCC/C-rated companies defaulted at an average rate of about 26% within one year and about 47% within five years. By comparison, single-B companies averaged about 2.9% (one year) and 15.6% (five years), BB companies about 0.6% and 5.8%, and the entire below-investment-grade universe about 3.5% and 13.6%. Default rates rise sharply in recessions, but the takeaway is clear: higher yields can be tempting, and they come with real risk. That’s exactly why we’re selective about where we reach for income on your behalf.
If any of this has you wondering how your portfolio is positioned, reply to this email or give us a call. We’re always happy to help.
Hope you have a great week, and remember, volatility is the price of admission.