
You’ve probably heard someone say it recently, or maybe you’ve even thought it yourself:
“How can the S&P 500 possibly be worth 7,500? It was at 3,000 just a few years ago.”
That feeling has a name. Behavioral economists call it anchor bias, our tendency to fixate on a number we saw in the past and use it as a measuring stick for what something “should” be worth today. It’s a very human reaction, but it can lead us astray as investors.
Here’s the key thing to remember: 7,500 and 3,000 are just numbers. What actually drives the stock market’s value is the ability of companies to generate earnings. Over the last 30 years, S&P 500 earnings per share have grown from roughly $20 to nearly $300 powered by revenue growth, margin expansion, share buybacks, and inflation. When something compounds at 7–8% per year, the chart will always trend up and to the right. That’s not a bubble, it’s math.
Of course, markets do go down, sometimes sharply. But historically, they’ve gone up more than they’ve gone down. As long as companies keep growing earnings, inflation stays moderate, and investors are willing to pay a fair price for future cash flows; the long-term direction remains upward. So, the next time a big index number gives you pause, remember it’s not the price that matters. It’s what’s behind it.
The American Consumer: Resilient, But Not Uniformly So
Total U.S. household debt hit $18.8 trillion at the end of 2025, a number that sounds alarming until you put it in context. The more telling figure is how manageable that debt actually is. The Federal Reserve’s Debt Service Ratio, which measures how much of our disposable income goes toward debt payments, sat at 11.32% in Q4 2025. That’s still below pre-pandemic levels and well below the 13.2% peak we saw right before the 2008 financial crisis.
Another buffer worth noting; roughly 92% of outstanding mortgages carry fixed rates, which means most homeowners are largely insulated from today’s higher rate environment.
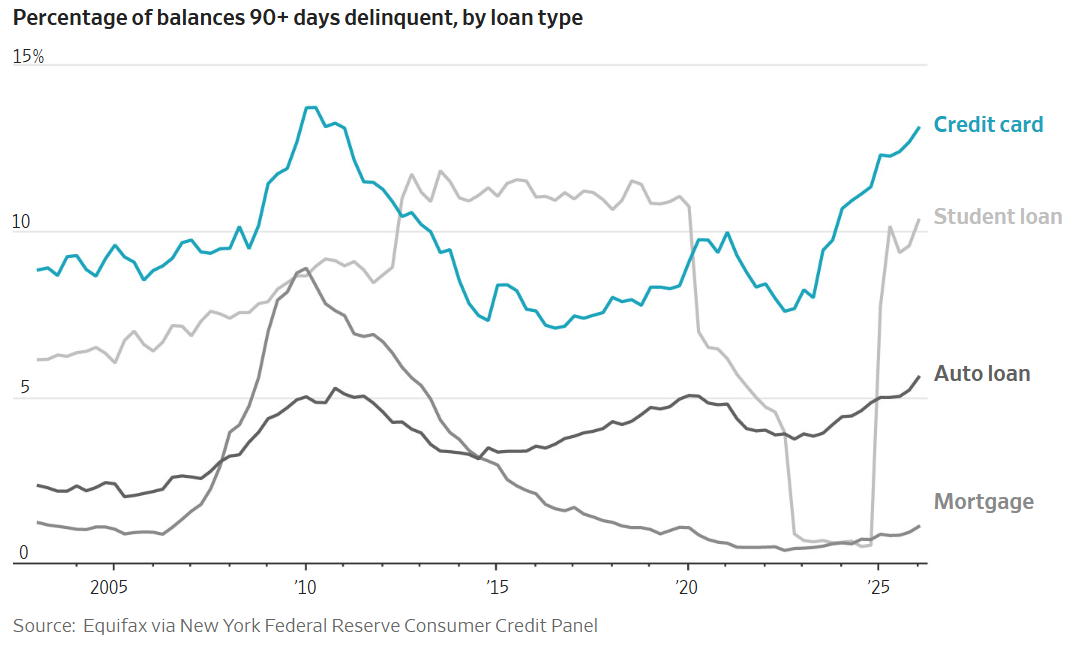
That said, there are some cracks worth watching. Delinquencies, loans 90+ days past due, have been ticking up across most loan categories. Credit card balances hit a record $1.28 trillion in Q4 2025, with average interest rates above 22%.
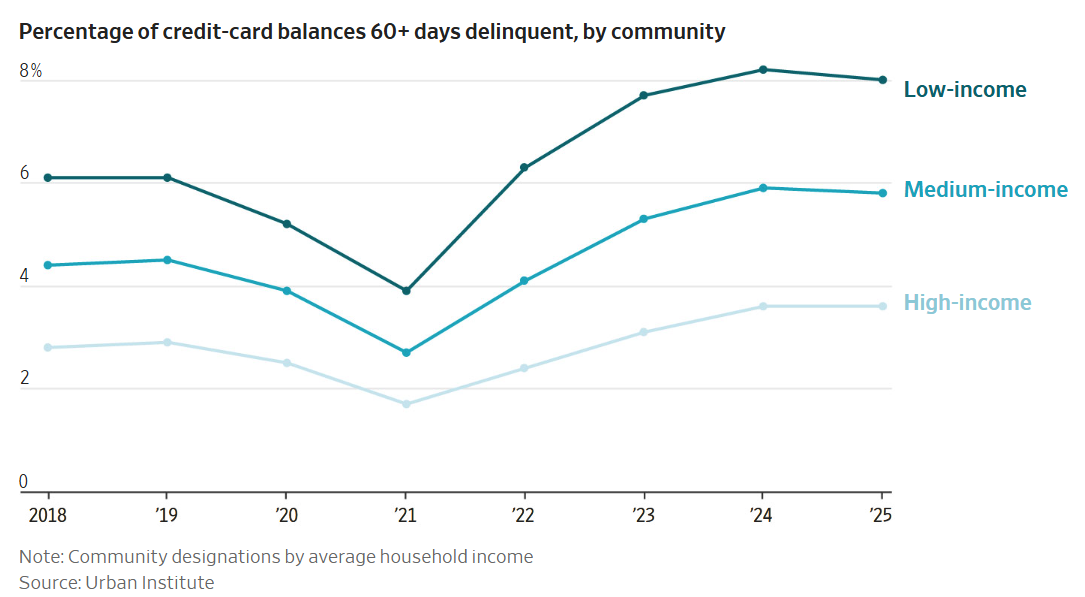
Our takeaway: the American consumer isn’t in crisis, but the picture isn’t uniform. The median homeowner locked into a low fixed-rate mortgage is in solid shape. The household carrying a high-interest credit card balance month to month is under real pressure. The data shows this divergence clearly when you break it down by income level those at the top are holding steady, while those at the bottom are increasingly stretched.
Inflation Ticked Up, But the Trend Is Less Scary Than the Headline
The Federal Reserve’s preferred inflation measure – headline PCE – came in at 3.8% in April, the highest reading in three years. The jump was driven almost entirely by higher oil and gasoline prices. Core PCE, which strips those out, rose to 3.3%.
Here’s the nuance that matters: while the annual numbers are elevated, the month-over-month increases actually came out softer than economists expected. That’s part of why bond yields eased after the report. In other words, inflation is higher than we’d like, but it’s not accelerating as fast as feared.
What this means at ground level: higher prices are slowing eroding household savings. The personal savings rate fell to 2.6% the lowest since the summer of 2022, the last time we saw a major inflation spike. People are dipping into savings to keep up with the cost of living. And yet, consumer spending has remained remarkably resilient….Everyone complains about prices and then keeps buying anyway.
We hope you have a great week ahead. And as always, volatility is the price of admission.
Warm Regards,
Morgan & Josh
You can reach Park City Wealth Advisors to begin the conversation by scheduling a conversation here or calling or texting (435) 500-5979.